Plant-species hotspot maps identify priority conservation areas of tropical Africa
Naturalis Biodiversity CenterIdentifying critical areas for global biodiversity is an important step when prioritising areas for conservation, and generating biodiversity hotspot maps based on global species ranges, at a scale usable by local management, has been a long-term ambition in the field.
New research by a team led by the University of Oxford and including Jan Wieringa of Naturalis Biodiversity Center, has realised this ambition for tropical Africa, making use of 3.1 million global distribution records of more than 40,000 African plant species to map the areas that are home to the world’s rarest plants.
The study, which makes use of a scalable concept defined as ‘bioquality’, is published in the journal Current Biology.
Study author Cicely Marshall, a doctoral candidate in Oxford’s Department of Plant Sciences, said: ‘This is an important framework for African conservationists, botanists, researchers and policy makers, offering a quantitative and replicable approach for measuring the irreplaceability of particular local areas for global biodiversity conservation, and for comparing those areas within their global and regional context.’
The researchers first summarised the global range of all plant species in tropical Africa into one of four standardised ‘Star’ categories of global rarity. Black Star species are the world’s globally rarest plant species, known from only a few localities worldwide. By contrast, Green Star species are globally widespread, while Gold and Blue Star species are intermediate.
 The study used these Star ratings in combination with species distribution data to measure bioquality at different scales across the continent, using a scale-independent index. High bioquality implies a high proportion of globally rare plants in an area, species that stand to be lost from the global pool. The bioquality map reveals the most significant areas for global plant biodiversity continentally, but also reveals considerable variation within these areas at a more local scale.
The researchers found that the Horn of Africa region is among the ‘hottest’ for plant biodiversity, as are the south east Democratic Republic of Congo, the Cameroon and Gabon coastlines, and the Karoo Namib floristic region on the Angolan coast.
‘Our map for tropical Africa displays not only the most important regions from the point of view of nature protection, it shows that there is considerable variation within hotspot regions, some local patches of vegetation are much hotter than others, and at local scales there is usually scope to alter development plans to biodiversity minimise loss.
‘Although published botanic data allow broad patterns of plant biodiversity to be understood, as shown in the continental bioquality map, the detail of local plant distributions is still very much absent for most of Africa. It remains as necessary as ever to collect and identify plants to make informed management decisions at the local scale, particularly as a prelude to local development. Our framework allows any new records and flora surveys, at any scale, to be assessed for bioquality and incorporated into the continental map, building into an ever more detailed picture.’
 Dr William Hawthorne, a co-author of the paper, added: ‘Conceptually, bioquality moves us beyond simple measurements of the numbers of species in a place and allows species to be valued unequally in conservation assessments. For example, the presence of alien or invasive species brings bioquality scores down, rather than adding a species to the total. Furthermore, the standardisation of the bioquality index allows meaningful comparisons to be made between patches of vegetation in any part of the world, potentially a useful consideration for international agencies when allocating global conservation funding for biodiversity conservation, or when considering where new developments will have least impact on biodiversity.’
‘Practically, the bioquality method for conservation assessment offers new analytical flexibility at a local scale, allowing practitioners to “zoom in” on areas of general importance to measure the global significance of particular areas for plant biodiversity within precise, local boundaries of interest. It is at this scale at which information is needed, because this is the scale at which decisions impacting plant biodiversity are usually taken. Where, precisely, to position a new protected area? Where to develop infrastructure? How to measure the impact of a new development on biodiversity? How to identify an equivalent area for offset? We now have the framework to answer such questions objectively across tropical Africa.’
Text: University of Oxford and Naturalis Biodiversity Center
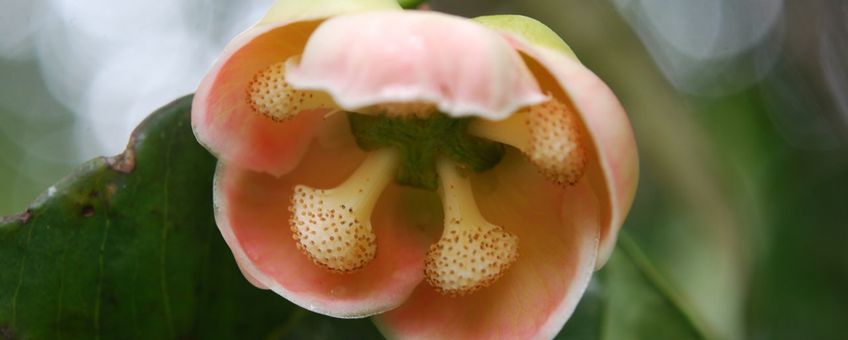
Photos: Jan Wieringa, Naturalis (leadphoto: Allanblackia gabonensis (Pellegr.) Bamps, "Blue star" species)
Map: Cicely Marshall, Jan Wieringa and William Hawthorne
